
This is part 3 of the blog series "Measuring pressure difference in practice", in which we use hands-on tests to find out what affects the results of pressure difference measurement – and what doesn't.
Part 1: The effect of equipment – How do the material, length and type of tube affect the results?
Part 2: The effect of placement – How does the placement of the meter and tubes affect the results?
Part 3: The effect of wind (this article) – How does wind affect pressure difference measurement?
Why did we test this?
In the first part we tested the effect of the measuring equipment and in the second part the effect of device placement. Now we move on to a single major source of interference that you can do very little about: wind.
Wind is the unpredictable variable in pressure difference measurement. Anyone who measures knows that on a windy day the results "jump around" – but by how much, in which direction, and how should you take it into account? We installed meters on four different walls of a building and let the wind do its thing for a week.
TL;DR
-
In our test, wind caused a difference of up to 14 Pa between the results on different sides of the building – in winds below 10 m/s
-
In calm weather all four meters show practically the same reading
-
The same wind speed from a different direction can produce completely different results – the microclimate and the location of the measuring points are decisive
-
Always measure from at least two points so that the effect of the wind can be analysed
-
A pressure difference is real whether it is caused by wind or by ventilation – but interpreting the results requires wind data
Test setup
Test site
The same building as in the previous parts: an 80-year-old two-storey detached house with natural ventilation.
We installed four Loop Delta pressure difference meters on four different walls of the building. All meters were installed on the ground floor at the same height of 0.8 m, and the wall penetrations were made with capillary tubes run through the window seals, without drilling any holes.
The wind data comes from Pirkkala Airport, about 30 km from the test site. During the test period the outdoor temperature varied between about −5 and +10 °C.
The week at a glance
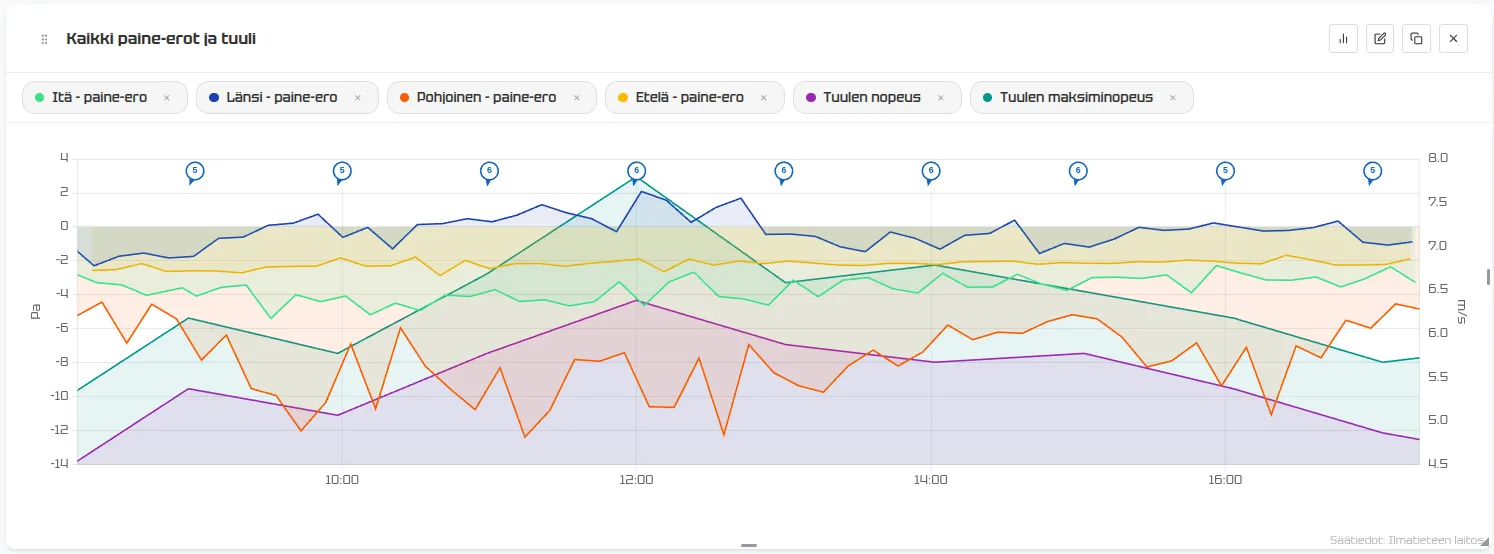
Let's first look at a one-week graph showing the pressure differences on all four sides of the building together with wind speed and direction.
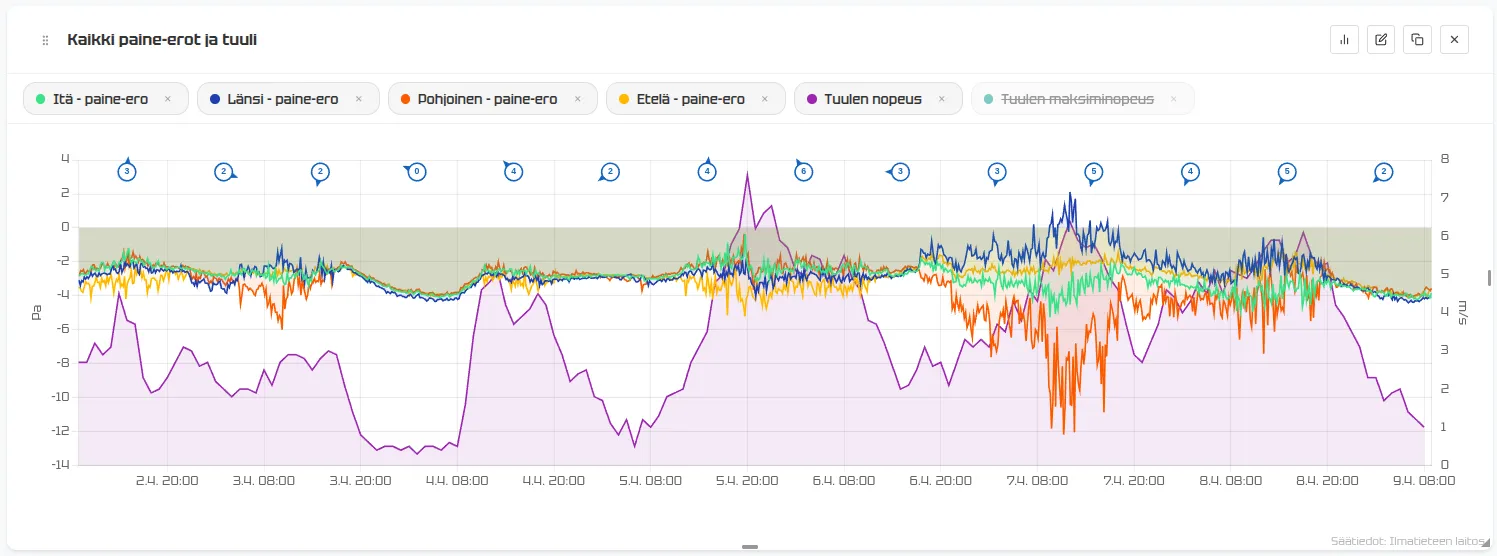
This graph alone reveals several interesting things.
Natural ventilation works
The pressure difference is negative all the time – that is, the building is under negative pressure relative to the outdoor air. In this weather natural ventilation works perfectly well.
Wind has a significant effect
When it is almost calm, all four meters show roughly the same result. But when the wind picks up, the situation changes dramatically.
The windward wall shows a greater negative pressure. This is because the pressure inside the house stays relatively stable, while outside the wind creates positive pressure on the windward wall. According to the measurement, the negative pressure therefore increases.
On the leeward wall the situation is reversed – the wind creates negative pressure there, so the pressure difference decreases or even turns positive.
An interesting observation: the positive pressure the wind creates on the windward side always seems to be smaller than the negative pressure it creates on the opposite side of the house.
Note: Don't draw overly precise conclusions about wind direction and strength, as the weather station is more than 30 km away. The local wind can differ considerably.
A closer look at the site
Before we dive into the details, let's look at the test site on a map.
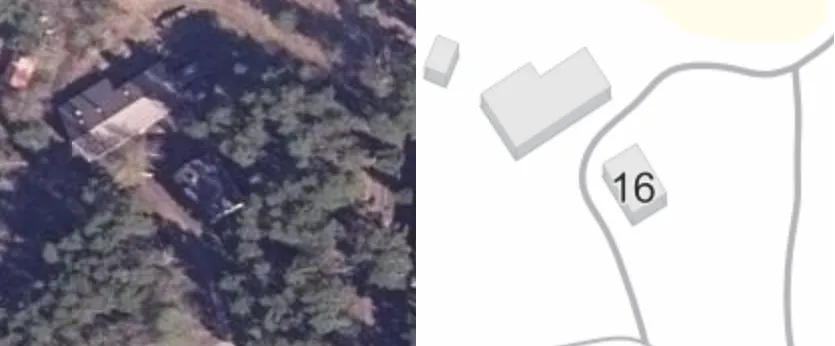
The map reveals a few important things:
- "South" is not south. The wall we call the south wall actually faces more south-south-east. The orientation of the building clearly differs from the cardinal directions.
- A neighbouring building is right next door and affects how the wind behaves.
- There is forest on almost every side, and the gap made by the road creates a kind of wind tunnel.
- The position of the meters on the wall can make a big difference: the wind swirls at the corners, and the porch creates eddies of its own.
All in all, we are looking at the results of a very complex phenomenon. It is genuinely hard to know how the wind behaves around a building without precise measurements at the site itself or a microclimate analysis.
Two interesting observations
Let's pick two moments from the week's data that say a lot about the effect of wind.
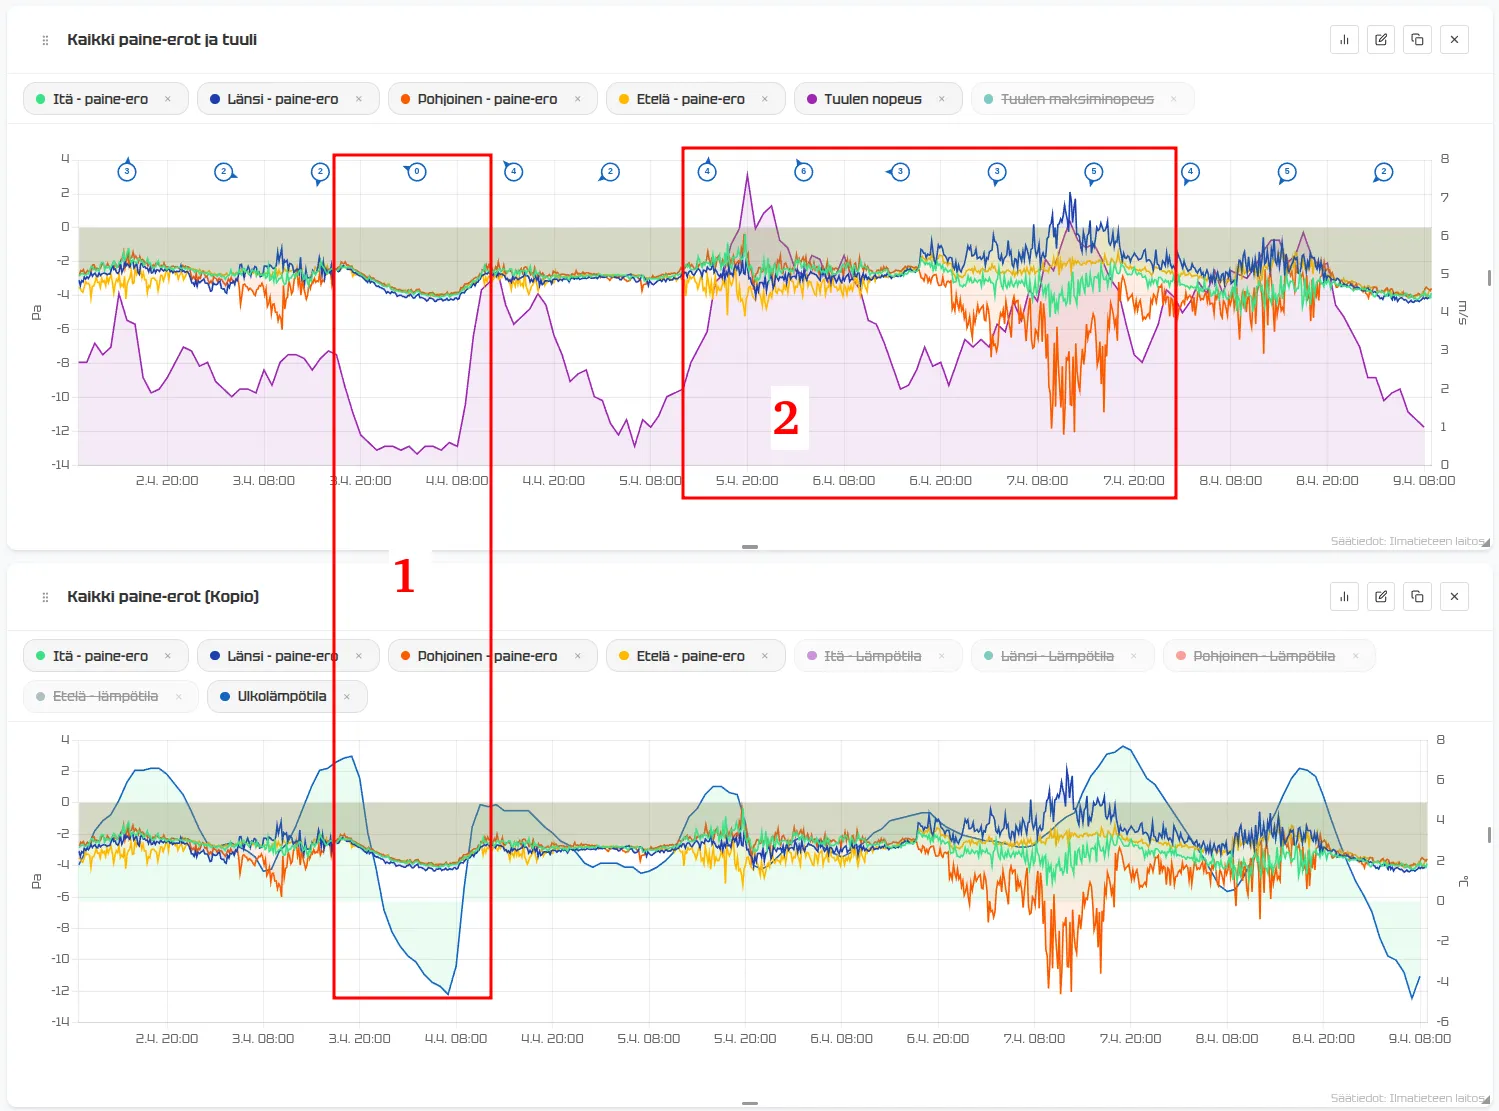
Observation 1: Calm and cold – natural ventilation at its purest
The first moment is a completely windless, cold night. The wind speed is below 1 m/s and the outdoor temperature drops overnight from +7 °C to −5 °C.
The graph clearly shows two things:
-
In windless weather all meters report practically the same pressure difference. This confirms that the differences we see at other times are caused specifically by the wind – not by the meters or the installation.
-
The drop in outdoor temperature increases the building's negative pressure from about −2 Pa to −4 Pa. This is exactly how natural ventilation behaves: in colder weather the stack effect grows stronger and the negative pressure increases. It is also why in summer you feel like opening a window – natural ventilation simply doesn't work when the indoor and outdoor temperatures are close to each other.
Observation 2: Same wind speed, completely different result
The second observation is perhaps more surprising. The week's data contains two periods in which the wind speed is about the same, but in one the measured pressure differences are within about ±1 Pa of each other, while in the other the spread is as much as ±6 Pa. Why?
Let's look at both periods more closely.
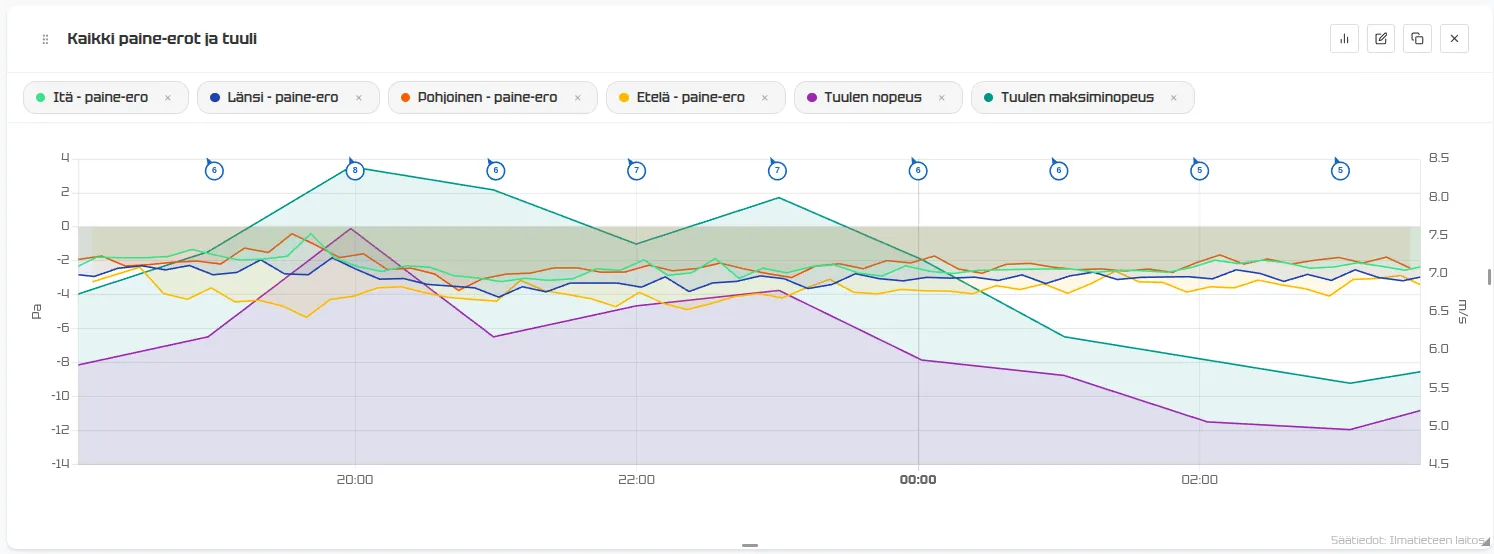
The graphs show that the northerly wind actually comes slightly from the north-east. Considering that the house is not aligned exactly north–south, it is no wonder that the west wall is affected more than the south wall. The "southerly wind" is in fact a north-easterly wind running fairly parallel to the house.
But the big question is: why can the same wind speed from a different direction cause such different measurement results?
The honest answer is – we have no idea :)
Our theory is that there are two reasons:
-
Microclimate. The forest, the neighbouring building and the wind tunnel along the road shelter the building from some directions and expose it to others. A southerly wind may be filtered through the forest, while a northerly wind can blow more freely.
-
The position of the measuring points on the wall. Corners, eaves and the porch create local eddies that can amplify or dampen the effect of the wind at the measuring point.
We will look into both topics in future blog posts, with the help of an expert.
Conclusions
What can we conclude from these results? In our view, at least three things.
1. Always measure in more than one place
The results show that a wind of less than 10 m/s caused a difference of up to 14 Pa between the results on different sides of this building. If you collect measurements from at least two points, it is much easier to analyse the results and to separate the effect of the wind from, for example, the effect of the ventilation.
2. Always analyse the data together with the wind conditions
When you look at wind direction and speed alongside the measured pressure differences, it is easy to tell which changes are caused by the wind and which by something else. Without wind data you can draw completely wrong conclusions from pressure difference data.
3. A pressure difference is a pressure difference – come rain or shine
In the long jump, a leap of over 9 metres doesn't count as a record if the tailwind during the jump exceeds 2 m/s. So should results measured in windy conditions be thrown out in pressure difference measurement too?
The answer is: yes and no. It depends on what you want to know.
If you want to know the building's actual pressure difference – a result measured in the wind is just as valid as one measured in calm weather. If there is 20 Pa of negative pressure across the wall relative to the outdoor air, then there is 20 Pa of negative pressure, whether it is caused by the wind or by something else. Air leaks into the building because of the pressure difference, and that affects both the structures and the indoor air. The measurement is entirely correct, but bear in mind that it describes the conditions at that particular wall or measuring point – not the building as a whole.
If you want to know how the building's ventilation is working – a result measured in the wind can be misleading. The ventilation may be working just fine and creating, say, an average pressure difference of −5 Pa inside the building. But if you happened to measure −25 Pa during a gust and adjust the ventilation accordingly – you'll get it badly wrong.
This was the third and final part of the blog series "Measuring pressure difference in practice". In future posts we will take a closer look at the effects of the microclimate and the location of the measuring points.