
TVOC measurement often raises questions: is 300 ppb a lot or a little? Is the air dangerous? Why do two devices show different readings in the same room? These are good questions – and the answers reveal something essential about what you can and cannot expect from TVOC measurement.
TVOC isn't one thing – it's thousands
Volatile organic compounds, or VOCs, are a huge group of different chemicals: paint solvents, cleaning products, furniture coatings, human skin and breath, cooking, cosmetics – all of them release their own compounds into the air. Formaldehyde, ethanol, toluene, acetone and benzene are all VOCs, but their chemical properties, health effects and hazards differ considerably.
TVOC stands for the sum of all of these – Total Volatile Organic Compounds. And therein lies the first challenge: the sensor doesn't know which compounds it is measuring. It detects a change in the air, but it cannot tell whether the source is a hazardous building material, a harmless bottle of sauce or a deodorant.
Absolute ppb values are hard to interpret
Sensors usually give the TVOC reading in ppb (parts per billion) or µg/m³, often as an ethanol equivalent. In practice, this means: "if this signal came from ethanol alone, there would be X ppb of it" – but in reality the air contains dozens of different compounds, to which the sensor responds with different sensitivities. The figure is therefore a kind of combined signal from all the compounds, not a precise concentration of a single substance.
Interpreting absolute values is made even harder by the fact that official guideline values – such as the limits set in Finland by the Ministry of Social Affairs and Health's Housing Health Decree – have been defined for laboratory methods, in which an air sample is collected in an adsorbent tube and analysed precisely using gas chromatography–mass spectrometry. A continuously operating sensor doesn't do the same thing: it doesn't separate the compounds, and the figure it gives is not directly comparable with the result of a laboratory method.
This doesn't mean that sensor measurement isn't useful – it means you need to know how to interpret it correctly.
Variation between devices is a recognised challenge
Another concrete challenge is the individual variation between sensors. A metal oxide (MOx) sensor, the type found in most TVOC measuring devices, reacts to compounds in its environment by changing its electrical resistance. The reaction is sensitive not only to the compounds themselves, but also to humidity, temperature and the individual characteristics of each sensor that result from manufacturing.
In practice, this shows up clearly in the data. Below is measurement data collected from six devices over the same period – all the devices in the same room, all measuring the same air.
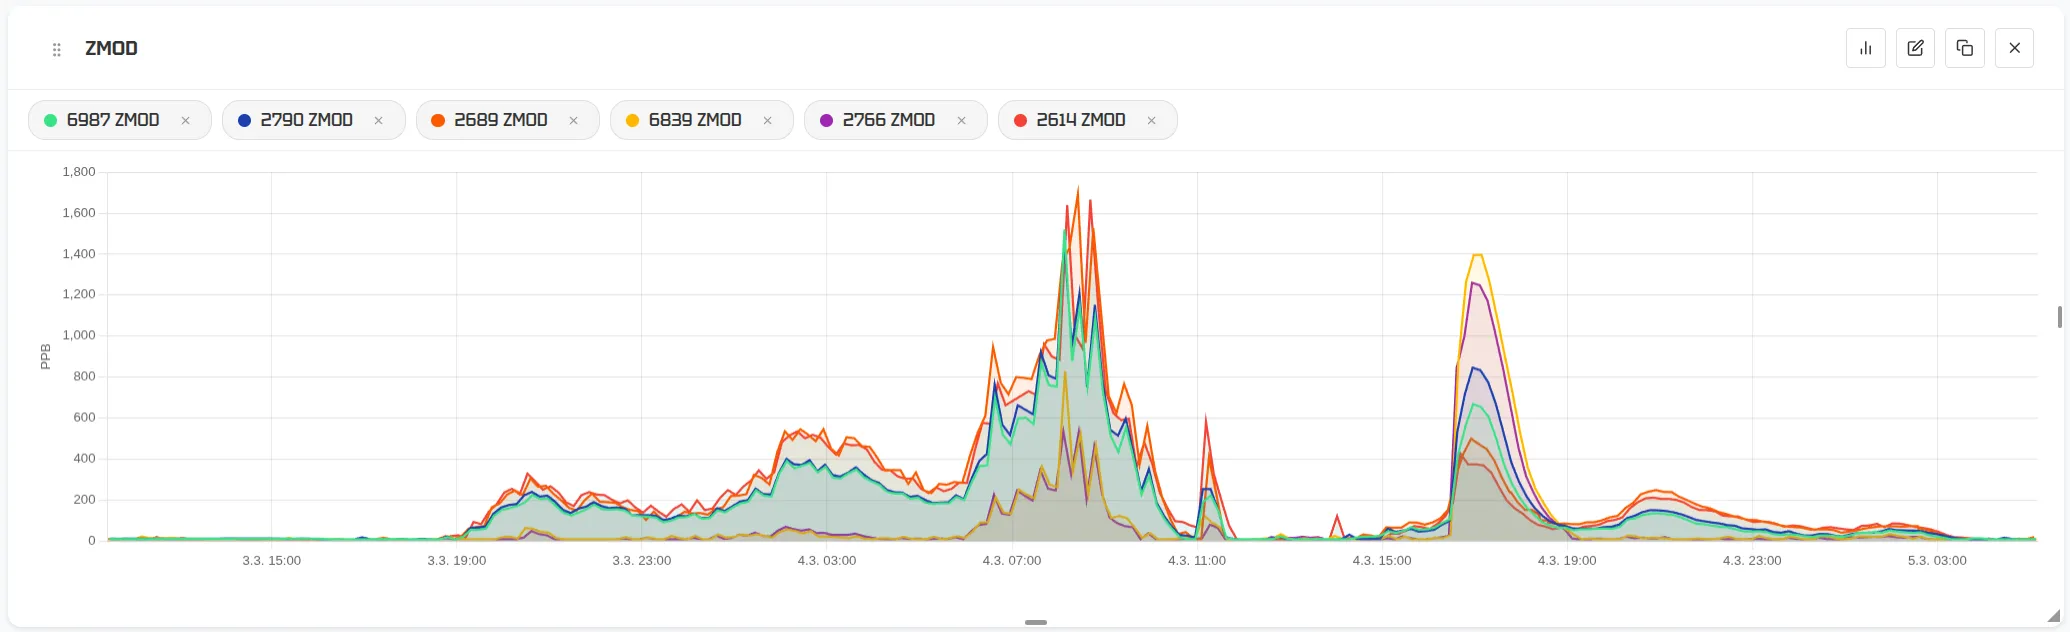
The events do show up on all the devices: the same spikes, the same trend, the same rhythm. But the ppb readings vary – one device shows almost 1,800 ppb at the peak, another less than 600 ppb for the same event. Which one is right? In reality, neither is "wrong" in the sense of the device being faulty – this is a recognised characteristic of these sensors.
An additional challenge is that the sensors' sensitivity ranking relative to each other does not stay the same. For example, the sensor that reacts least of all the devices to compound X may, 12 hours later, be the second most sensitive to compound Y.
A trend is more valuable than a single reading
By now, it may seem as though TVOC measurement is useless. It isn't – but its value lies somewhere other than in the absolute values.
What a TVOC sensor does reliably is detect changes. When something happens – ventilation deteriorates, an emission source is brought into the room, people arrive or leave – the sensor reacts. This continuous, real-time information is something a laboratory sample cannot provide: a single sample shows the situation at one moment in time, while continuous monitoring shows what happens in the space over time.
Practical questions that trend data can answer:
-
Does air quality improve when the ventilation is switched on?
-
Does the value always rise at a certain time of day – could the cause be a recurring activity or the rhythm of the ventilation system?
-
Is there a persistently elevated level in the space after new furniture has been brought in or a renovation carried out?
-
Does one space differ from the other spaces in the building – and is the difference permanent?
VOC index: a tool made for exactly this
When the goal is to monitor trends rather than measure absolute concentrations, the VOC index is a more appropriate quantity than ppb.
Sensirion's SGP41 sensor, included in all Loop One devices manufactured after 2023, produces a VOC index on a scale of 1–500. (Yes, they really do have two separate TVOC sensors.) It works like this: the algorithm continuously learns the normal air quality of the space and relates each measurement to it. A value of 100 means "this is normal for this space". A deviation tells you that something has changed.
| VOC index | Interpretation |
|---|---|
| 1–100 | Better than normal – all OK |
| 100 | Normal baseline for the space |
| 100–150 | Slightly elevated |
| 150–250 | Clearly elevated |
| 250–500 | Significant event – strong emission source nearby |
Because the index is relative – not absolute – the spread between devices is considerably smaller. Here are the same six devices as before, now with the SGP41 index and the ZMOD4410 absolute values included.
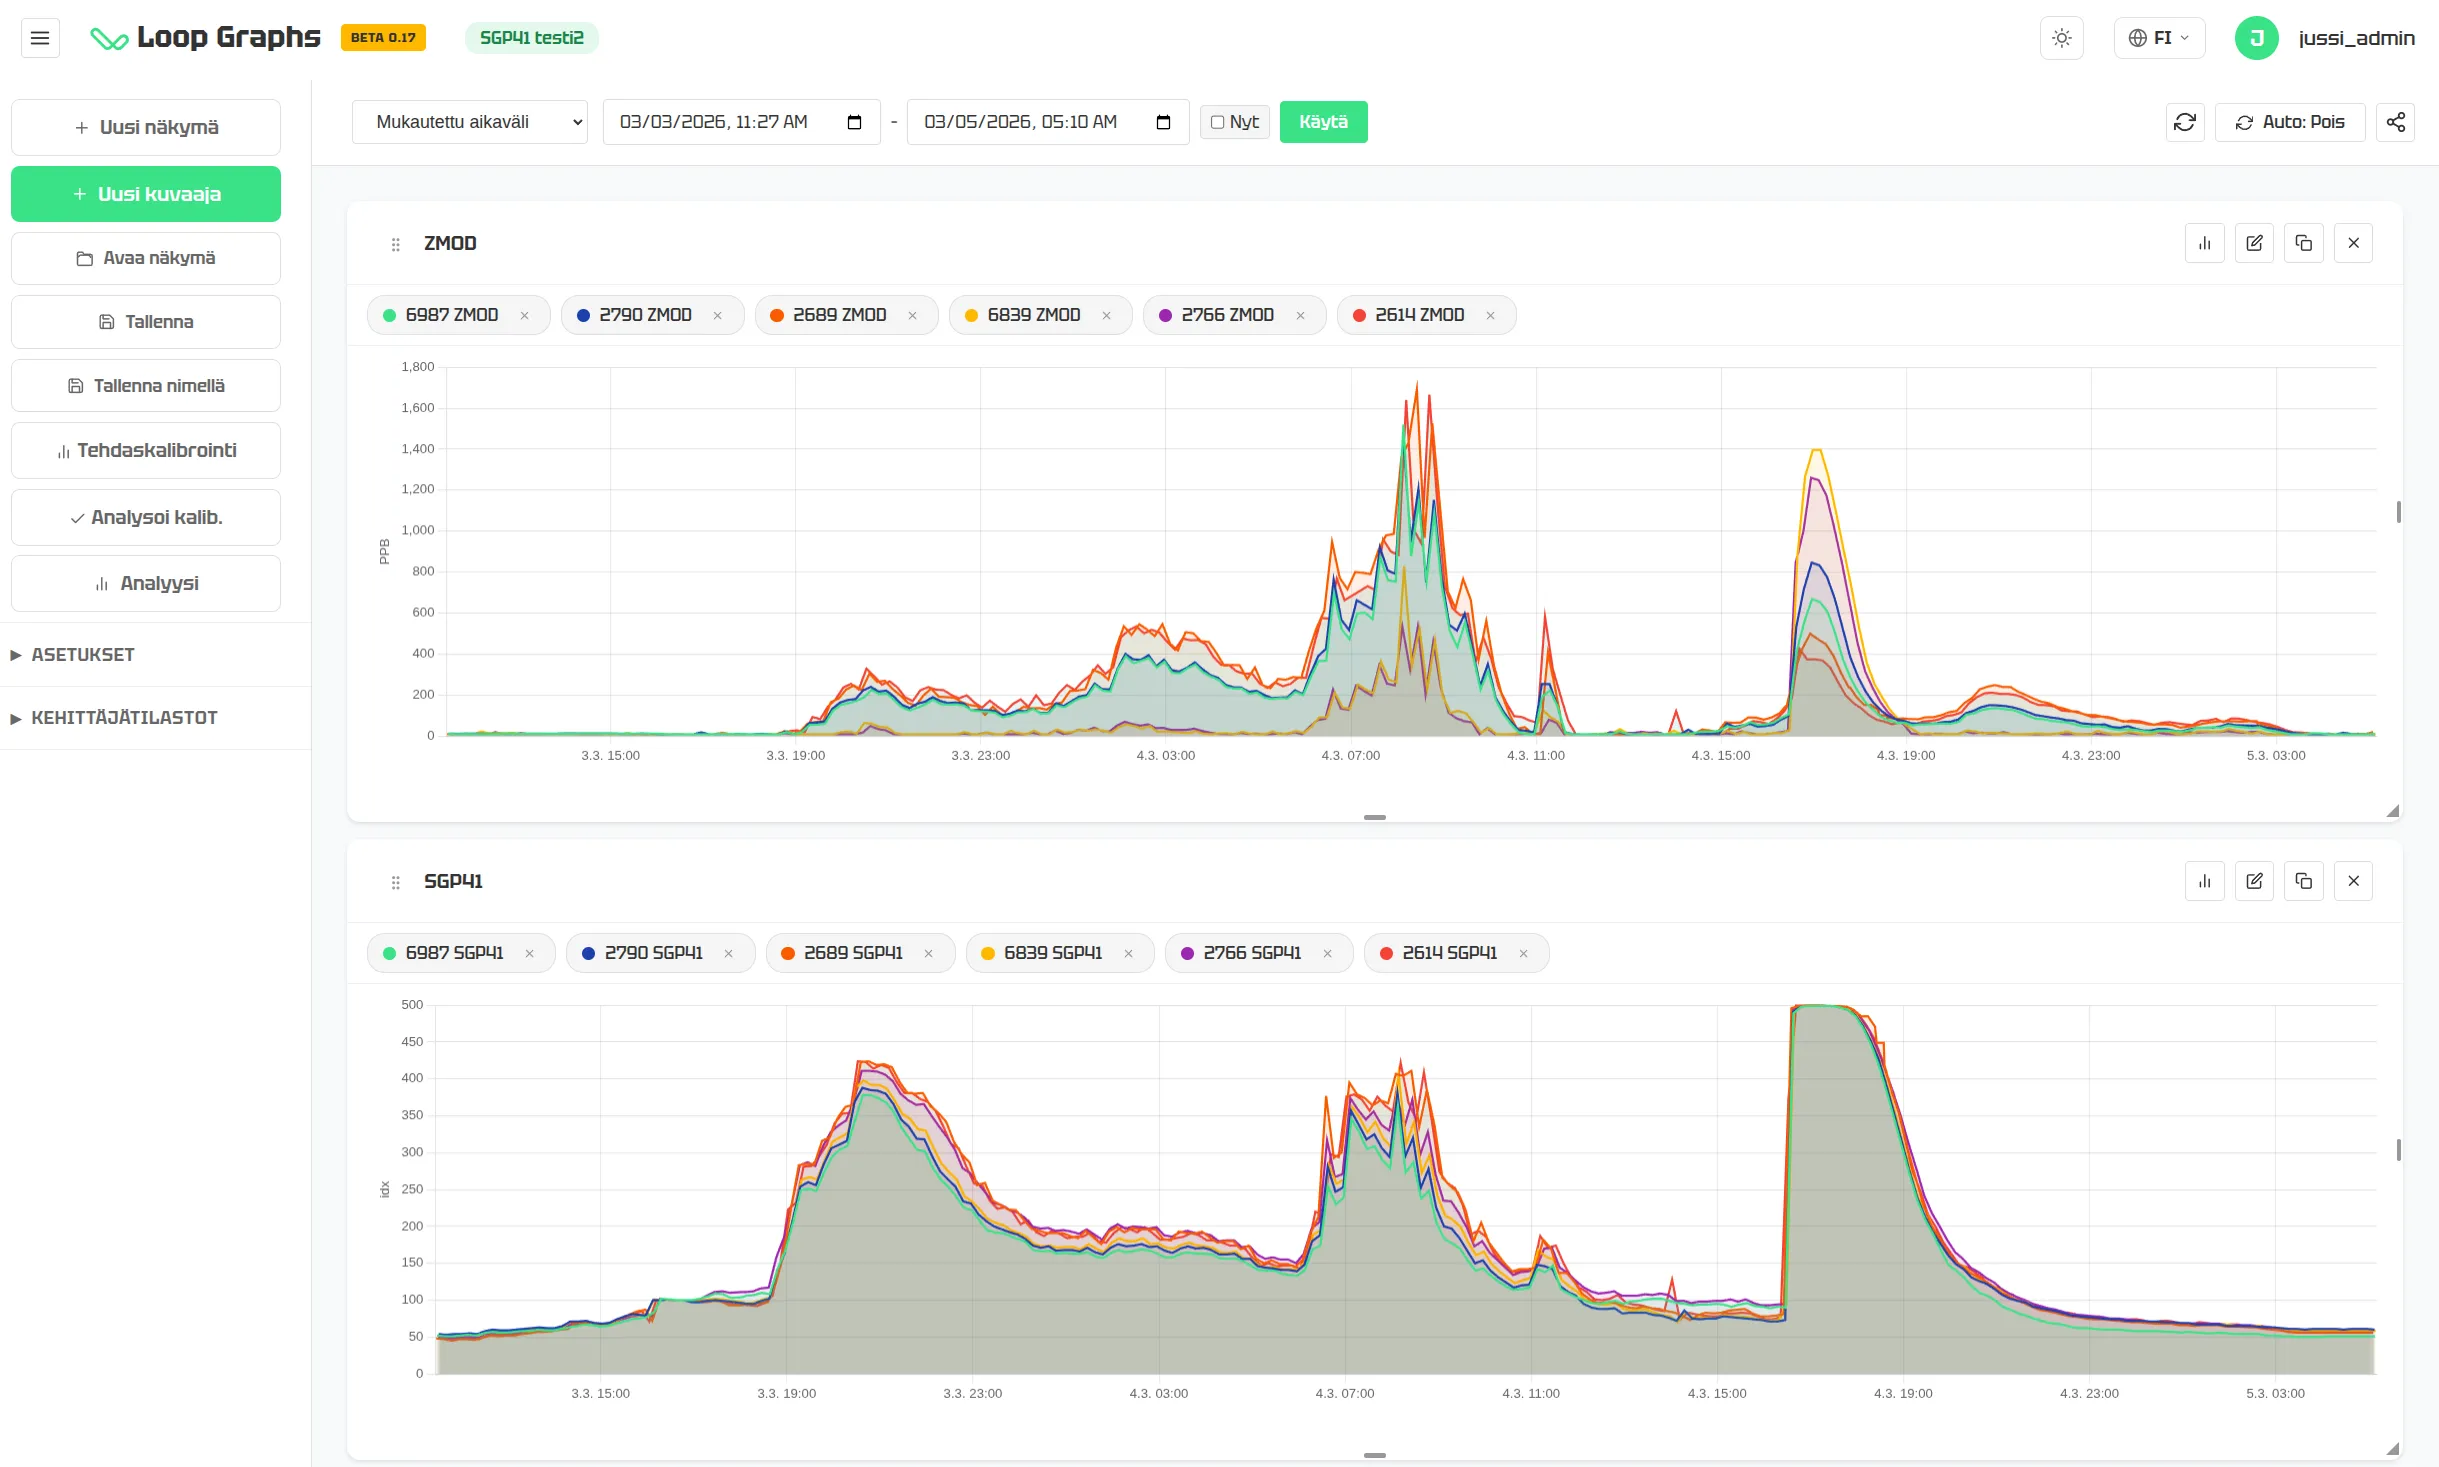
The events are the same, but the consistency between the devices is on a completely different level. This makes the index a reliable tool, especially when comparing several spaces or several devices with each other.
A practical example: what does the data tell us about everyday life?
Finally, let's look at a concrete example of data analysis. The data below comes from one of the devices above, over the same period. The graph shows both the VOC index (green) and the carbon dioxide concentration (blue).
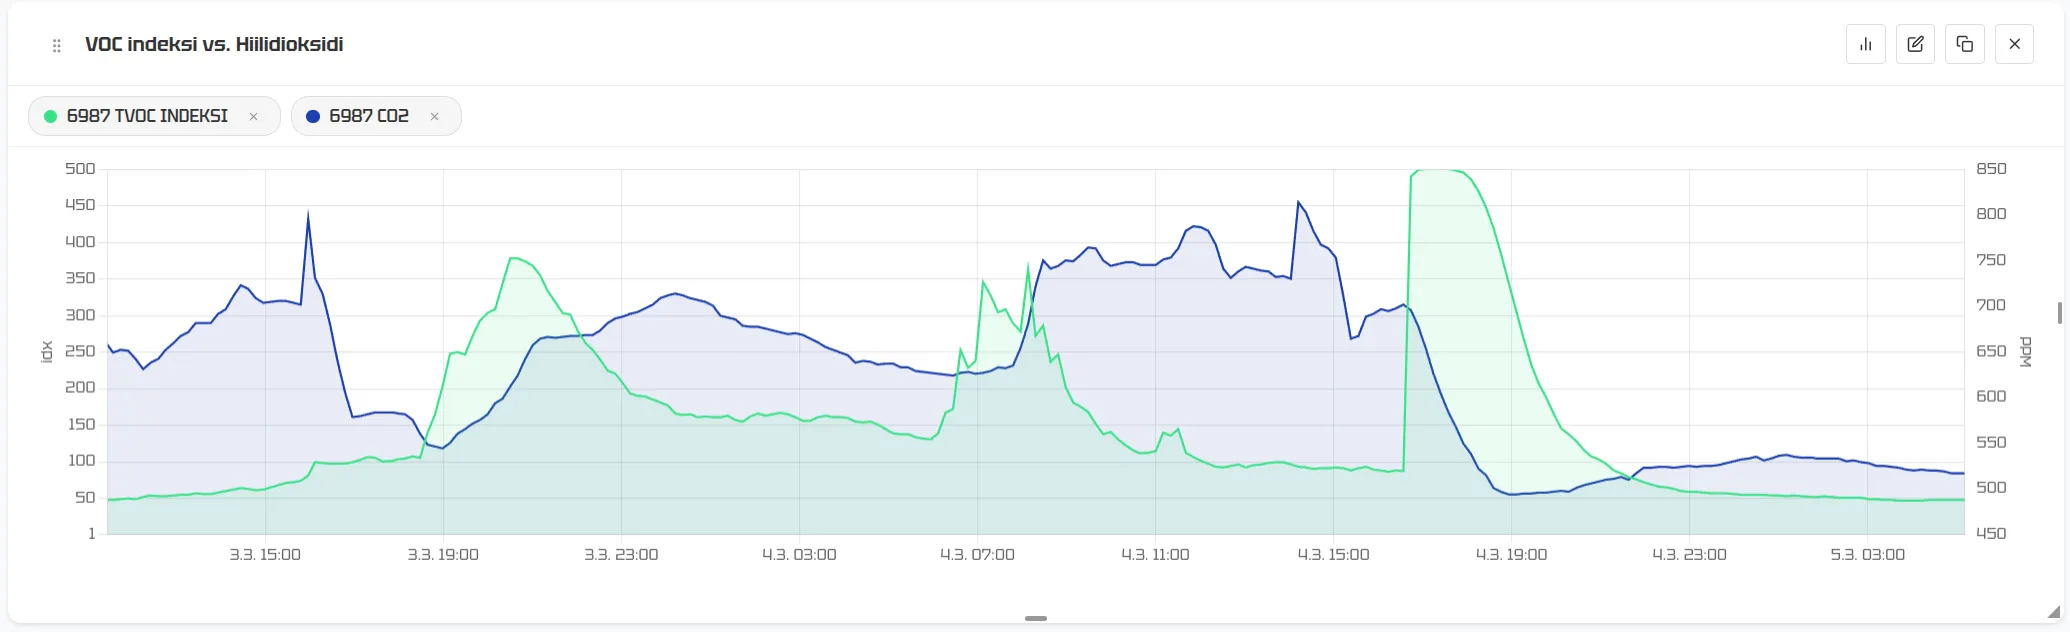
The data covers ordinary everyday life in a home office: sleeping, waking up, cooking, a day of remote work – and one controlled test. The room being measured is in a 70-year-old detached house with sawdust insulation and natural ventilation.
The data reveals two clearly different types of event:
Human activity shows up in both: In most cases, the VOC index and CO2 rise together – cooking in the kitchen, people in the room, ordinary chores. Carbon dioxide tells you about people; VOCs tell you about activities.
A VOC-only spike reveals a chemical source: At the end of the period there is an event where CO2 is falling and the room is otherwise quiet – but the VOC index shoots all the way up to 500. The explanation: a cloth with a few drops of ethanol on it was brought into the room. No people, no rise in CO2 – but the sensor detects the volatile compound immediately.
This combination is extremely useful in practice. When both rise, the cause is probably human activity or insufficient ventilation. When only VOC rises, the source is chemical.
Summary: what to expect from TVOC measurement
| What it can do | What it can't do | |
|---|---|---|
| Continuous sensor measurement | Detect changes and trends, compare spaces with each other, identify anomalies | Identify individual compounds, compare results with official guideline values |
| Laboratory measurement | Identify compounds, compare results with limit values, draw official conclusions | Monitor ongoing variation in real time |
The value of TVOC sensor measurement lies above all in making the invisible visible – continuously and in real time. It does not replace laboratory analysis when precise concentrations or official conclusions are needed. But it tells you when the situation has changed, and gives you a reason to find out why.
The VOC index makes this trend monitoring even more reliable – consistent results across devices, a clear scale and a structure designed specifically for detecting anomalies.